

Hi. I'm pileoflemons.
https://github.com/PileOfLemons/PileOfLemons-graphs
This is just me sharing a little python project I made and wanted to show it off. It doesn't do anything too fancy.
It prompts for a date range. a format. and a ranking. goes and gets the usage, leads, and moveset json files from Smogon.com/stats/ for the stuff that involves those inputs.
Then pretties them up a bit taking them from the easy to read but hard to parse formatted versions into just simple json files. I even combine the three files into one to make it easier to use later. It then does this for every month.
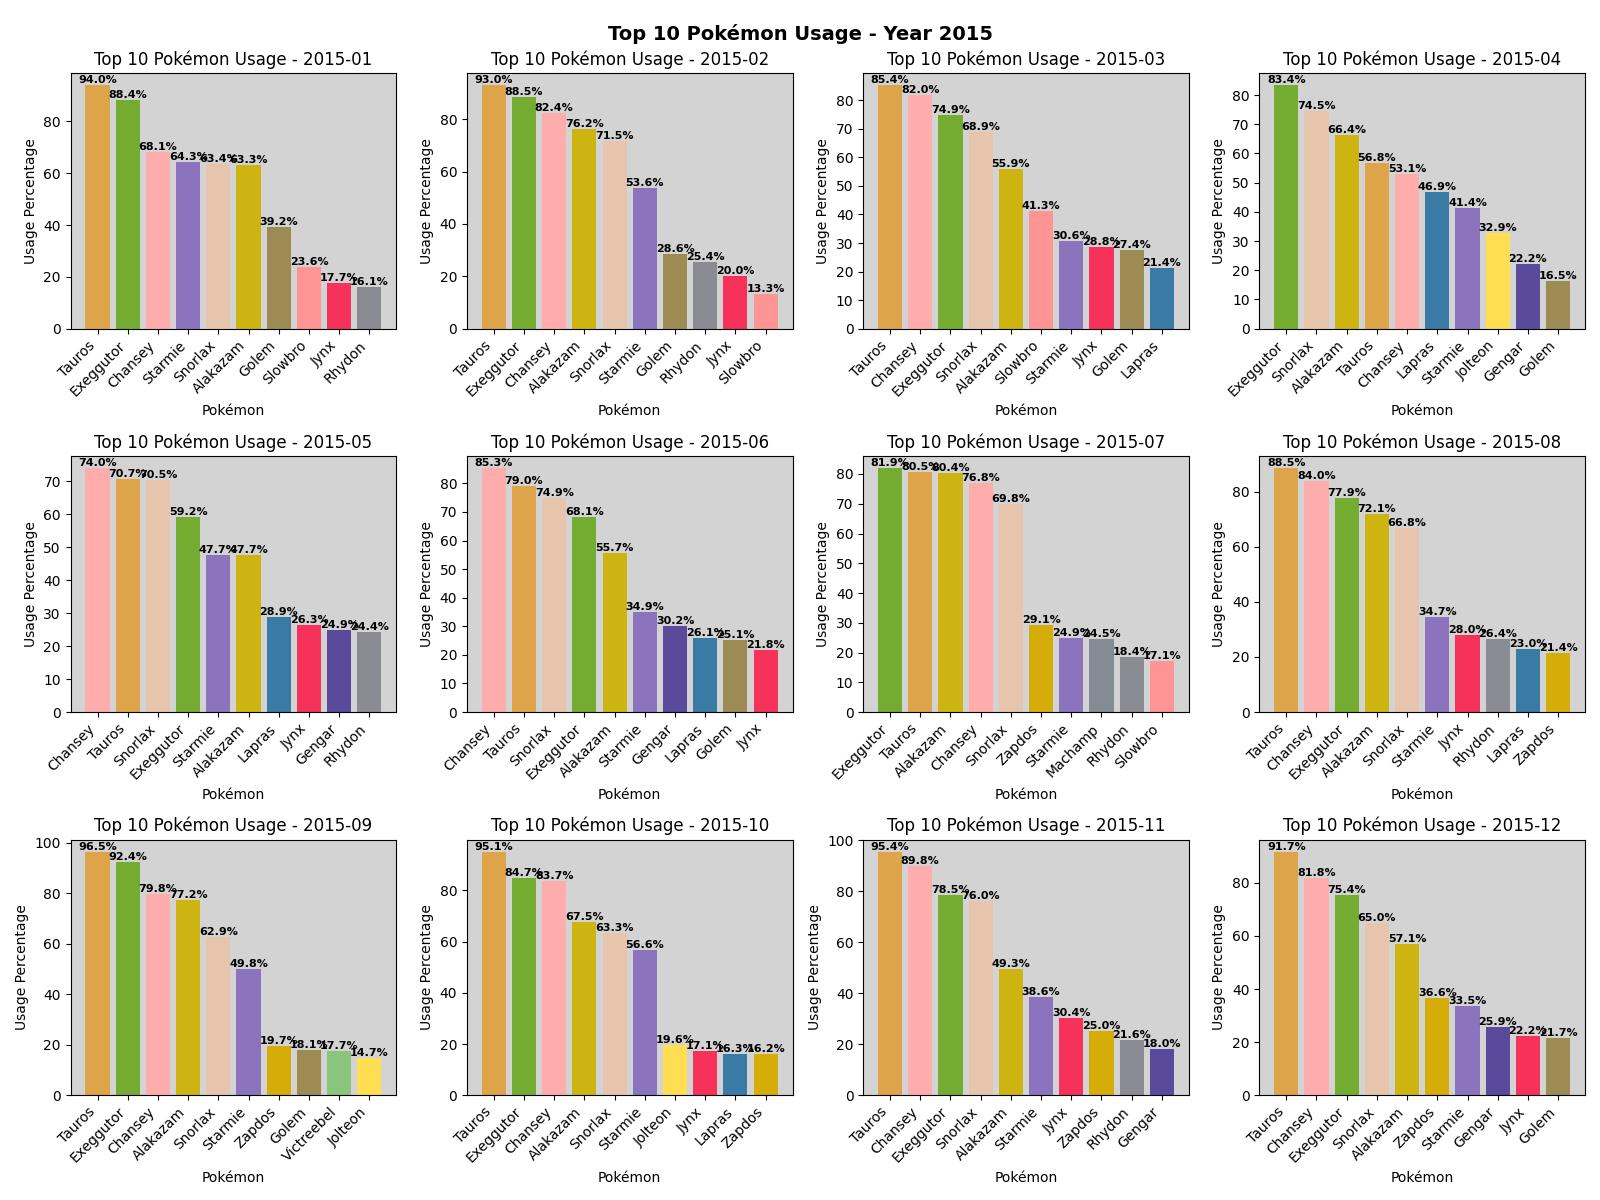
Last thing it does is graph them simply. It just takes the usage_perc value from those files for each month. and graphs the pokemon and usage percentage per month so you can see who the top pokemon were used for each month. And it gathers a whole years worth of graphs and puts them on one page and displays that. It will display all the graphs but can also save them into a jpg if you tell it to.
It also just grabs a list of every pokemon that was involved in the graphs at all and displays that with the amount of times it was ranked in the top 10. This was included so people can have an easy to grab way to see who all the pokemon were in case they wanted extra analysis or write about them without having to look at every graph.
I will keep updating and making it better. I will take any suggestions, requests or problems here or on discord at pileoflemons.
I'm not sure if this is anything anybody will be interested in. But it should work for most any format/ranking and time period. It's very flimsy so if its not doing what you want it to do thats kind of expected. let me know and ill try to fix or explain it
https://github.com/PileOfLemons/PileOfLemons-graphs
This is just me sharing a little python project I made and wanted to show it off. It doesn't do anything too fancy.
It prompts for a date range. a format. and a ranking. goes and gets the usage, leads, and moveset json files from Smogon.com/stats/ for the stuff that involves those inputs.
Then pretties them up a bit taking them from the easy to read but hard to parse formatted versions into just simple json files. I even combine the three files into one to make it easier to use later. It then does this for every month.
Last thing it does is graph them simply. It just takes the usage_perc value from those files for each month. and graphs the pokemon and usage percentage per month so you can see who the top pokemon were used for each month. And it gathers a whole years worth of graphs and puts them on one page and displays that. It will display all the graphs but can also save them into a jpg if you tell it to.
It also just grabs a list of every pokemon that was involved in the graphs at all and displays that with the amount of times it was ranked in the top 10. This was included so people can have an easy to grab way to see who all the pokemon were in case they wanted extra analysis or write about them without having to look at every graph.
I will keep updating and making it better. I will take any suggestions, requests or problems here or on discord at pileoflemons.
I'm not sure if this is anything anybody will be interested in. But it should work for most any format/ranking and time period. It's very flimsy so if its not doing what you want it to do thats kind of expected. let me know and ill try to fix or explain it


