When X-Act was working to find a mathematical method to measure centralization as a single number (here, here, here and here) he made several graphs which I thought were extremely interesting. The graphs contained more information than any single number, and could be understood in a general intuitive sense quite easily. Sadly whichever host he used no longer has them up, but the concept lives on and I decided to try my hand at putting together a few of them myself. When my data sheet is a little more organized I'll add it as an attachment to this post so anyone who wants can play around with it.
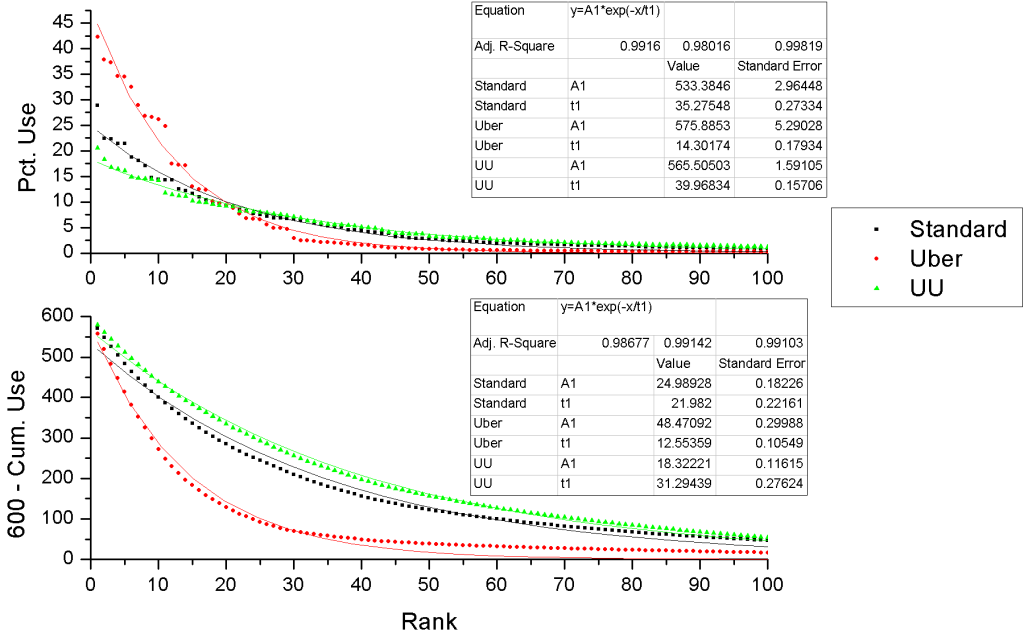
This is a simple line graph of % usage against Pokemon rank for the three most popular tiers. You can quite clearly see that usage in Ubers is much more tightly bunched around the high ranking Pokemon, that OU is somewhat middle ground (note Scizor sticking out there like a sore thumb!), and UU is spread out much more evenly compared to the other two.
% Usage from this graph is the same as given in Doug's stats: the % chance you will find the Pokemon on a random team.

Next I decided to make a cumulative usage graph to stop the "bumpyness" making the centralization less clear and to show the information in a different form. After trying a few versions I settled on 100-Cumulative usage/6 as the version which displays the information best. The division by six changes the usage from % chance of finding a Pokemon on a random team to % usage out of all Pokemon.

If anyone has suggestions for more of these I'd like t hear them. I intend to put together versions to compare the last few months centralization and probably some comparing centralization over the last few years, taking a sample every 4 months (original stats from the Official Server can be used for this) if there is interest.
So, any surprises? UU seems significantly less centralized now than just after the BL merge judging from what X-Act was saying. Has it just settled naturally into a more diverse state or was the previous centralization due to broken Pokemon which are now banned? Do you think that the centralization of all metagames (particularly OU) will have generally decreased or increased over the 2 and a bit years we have statistics for? And what will have caused spikes and dips in centralization?
Big thanks to Doug for the stats and X-Act for the original graphs.
Edit: If you're going to download one of the Jan stats zips use the second (Jan '10 stats2.zip), the other is only for historical interest/keeping track of how many people have got it, yet more people keep downloading it while the other is almost untouched.
Also, BSR BST Usage is probably more interesting for anyone who does not want to mess around and make their own graphs (Jan stats is Doug's stats in Excel form, with a few extra columns of data quickly generated from them), it has a big table of numbers about predicted BST/BSR based on usage rank and a graph included.
Edit2: If you want the stats just for easy copy pasting not to mess about with it in Excel this is probably easier.
Attachments
-
94.6 KB Views: 248
-
96.1 KB Views: 174
-
67.7 KB Views: 270