https://www.yapms.com/app/?m=499d
better tool for making a map imo
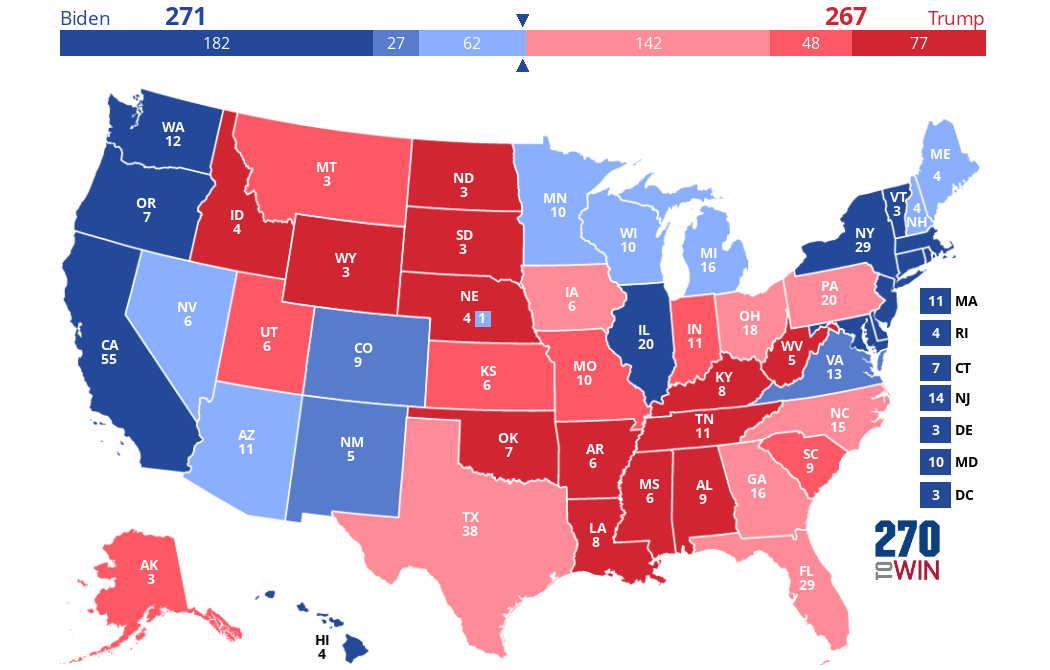
Edit: Also, here is my map
Tilt blue texas may be a bit of a "lolwut" but hear me out: Texas currently has above 108% the votes they had in 2016, mostly coming from in person early voting, with 1/10th being from mail ins. These voting methods traditionally benefit Democrats. Texas' highest turnout rate, when looking at percentage of the Voter Age Population, was 44% in 2016, which is bottom 5 in the country, and the highest it ever had was 47%. A massive increase to this, which could be possible if Texas gains millions more on election day, would smash Texas' previous % voting rate, and therefore give Democrats a better shot, as traditionally more turnout is better for Democrats. Texas has more registered Democrats than Republicans, but this is only a recent change, and independents in Texas usually split to Republicans, so the first fact isn't usually relevant. However, in this election, independents polled have been more likely to split to Biden.
The polls only hold a 1% lead for Trump, which already could shift left in the normal Margin of Error, but honestly I don't think the polls have taken into account the unprecedented increase in voter turnout in Texas. Not to mention, Trump led by 12 in Texas in 2016, and only won by 9, which suggests an overestimation of Trump support in Texas.
However, regardless of what may happen, unpredictable shenanigans may throw this into contention, or if those 100k votes from Harris County are thrown out, that could affect things too. Who knows.
edit 2:
https://electproject.github.io/Early-Vote-2020G/index.html
also check out this link on data for early votes and mail ins. The good news is that most relevant states already have received a majority of their mail ins.