


TLDR FAQ for voters
Q: This is a pain. Do I really need to rank every Pokemon precisely?
A: No, the beauty of the method is that you don't need to precisely rank things you don't know! Just rank approximately. If you can't properly rank C-tier mons, but know where the cutoff is from D-tier mons, and everyone else kind of agrees with you where the cutoff is, the tiers will be formed correctly regardless of how you ranked it.
Q: The tiers formed by this method don't make any sense! How do we relate it to S/A+/A/A-?
A: Strictly speaking, the methodology may create letter-labeled tiers that don't correspond to conventional notions, as the labels are determined by relative separations between ranking clusters. However, in practice, we come to some compromise with the VR coordinators and alter the labels to fit what people are used to.
Q: Do the final ranks actually matter?
A: The methodology spits out a ranked order of tiers, within which the mons' ranks are unimportant (see first question). However, since so much information can be obtained, the ranks are used to calculate the improvements and drops from previous VRs as well.
(do not read with Smogon Dark theme; you won't be able to see the graphs; click here to change your theme)
Check the 2nd post for major updates!
Hello everyone,
I'm here to share a mathematical-visual tool to the wider community for evaluating Viability Ranking (VR) tiers, especially contributors who do VR outside my main gen. I believe that an objective method founded in mathematics but visually convincing to a lay audience should appeal to a wide spectrum of people.
Recently, there has been some discussion on how to separate the ADV OU (my main) VR tiers. Questions such as "Should Zapdos belong in A+ or A", or "Is it even meaningful to separate the B tier into B-/B/B+?" were asked, and I believe I have come up with a tool helpful for answering these questions. I also hope that this post can elucidate the process to those who participated on that thread.
Key Assumptions
This methodology is premised on two key assumptions:
A1. Every mon in a tier should be mostly indistinguishable from any other in the same tier.
A2. Every mon in a tier should be convincingly distinguishable from every mon in another tier.
And mathematically, for reliability we require that
B1. Enough players contribute their VR, or outliers removed, so that the central limit theorem holds and ranking statistics can be treated as normal distributions. The standard deviation can thus be meaningful statistic.
Together, these premises require that
1. Within a tier, each mon has a ranking with standard deviation that stays within the mean (average) ranking,
2. At the transition from a higher to lower tier, the mean rankings will go from a overestimate to underestimate.
Methodology through an Example
Let's take a look at an instructive example. Imagine a world of eight pokemons where are there two tiers: the legendary trio and eeveelutions. Contributors to the VR gave the following ranking statistics (final integer rank, mean +/- deviation).
1, 1.9 +/- 1.0 Articuno
2, 2.0 +/- 1.0 Zapdos
3, 2.1 +/- 1.0 Moltres
4, 5.8 +/- 2.0 Vaporeon
5, 5.9 +/- 2.0 Flareon
6, 6.0 +/- 2.0 Jolteon
7, 6.1 +/- 2.0 Umbreon
8, 6.2 +/- 2.0 Espeon
We can do a scatter plot of these results.
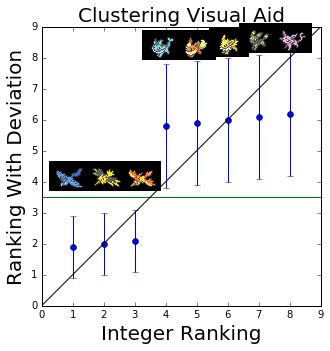
In this figure, I have plotted on the y axis the mean ranking +/- a standard deviation as error bars. On the x axis, I have plotted the final integer ranking decided by the mean rank. Notice that the legendary trio and the eeveelutions, which are the tiers, essentially form a flat line, and the deviations of each mon overlap the others mean rankings in the same group (satisfying A1), but do not overlap with those in the other group (satisfying A2). In my imaginary sample, contributors thought the legendary trio members were on the whole better than the eeveelutions, but could not decide convincingly among either group who came ahead. It is only by a small margin that Articuno and Vaporeon came ahead. This is exactly the definition of a tier at the start of the article, and tier boundaries can be defined this way.
How else could we have noticed this? On the same plot, I have drawn the diagonal line y=x, representing where points would lie if everyone posted the same VR. Ironically, this is a boring world where there are no tiers. A way to understand this is that tiers are born out of players' natural disagreements in rankings. The substitution of mons by different people in the same ranking position is what generates the idea that two mons are roughly the same quality. We can exploit this to define a tier too.
Points that lie below the y=x line are ranking overestimates: i.e. people clearly think of Moltres as in the same league as Articuno, but it is through the vagaries of a slight 0.2 disadvantage that it was relegated from roughly #2 on average to #3. It's like losing a really close semifinals with the champ and getting bronzes (sorry Hclat ). Similarly, points that lie above are underestimates. Vaporeon isn't Moltres standard by a longshot, but enjoys the luxury of being #4 instead of roughly #6 on average because someone needs to get the consolation prize anyway. Thus, the bottom of a tier will have its rank overestimated/underrated, and the top of a tier will be rank-underestimated/overrated (sorry this is a bit confusing, a rank overestimate is a numerically higher rank, which is a worse rank). A tier shift can be seen a jump from below to above the y=x line. This method is good for one's understanding but is less reliable than just looking at the means and deviations, because outliers can severely skew the points away from the diagonal line, causing all the points to be on one side like those of rank >30 in the ADV OU VR below.
The method of determining tiers now is simple:
Step 1. Plot the graph
Step 2. Find flat portions (I'll call this a tier-line) within the standard deviations of the mons that also exclude other mons. This defines a tier. To find the boundaries especially in more ambiguous cases, identify two consecutive flat-ish portions, and try to find the midpoint.
Step 3. This is not necessary but think of it as a real smoking gun: Find positions where there is a transition from below to above the diagonal line. This would define a tier shift when there are no outliers. (2) and (3) should almost coincide, and should exactly coincide if all contributors' votes did not spill to other tiers.
Real Data and Dealing with Ambiguity: ADV OU Viability Ranking 2019
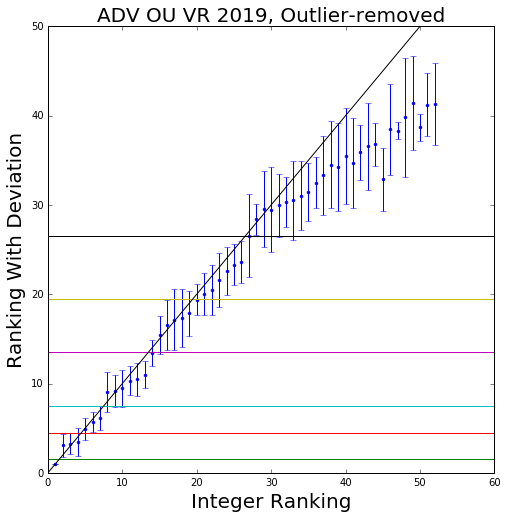
Finally, let's take a look at some real data. This is the same plot generated from outlier-removed data provided by McMeghan of the ADV OU VR in https://www.smogon.com/forums/threads/adv-viability-ranking-ou.3503019/post-8115920
To quote verbatim from my post over there,
1. Relax A1: Do not divide the tier into subtiers. Acknowledge that there will be variation within the tier.
2. Relax A2: Divide the tier into sections of the size of the error bars. Within each subtier the mons are now more equal, but it's not so easy to see the differences across subtiers. In my original post, I just subdivided the tier anyway with the yellow line, because the error bars were roughly half the size of the tier. This ended up making reasonable sense, and would eventually lead to the idea of subdivisions (next section).
The tiers eventually looked reasonable, and there are some surprises, such as the controversial Starmie not belonging in any tier.
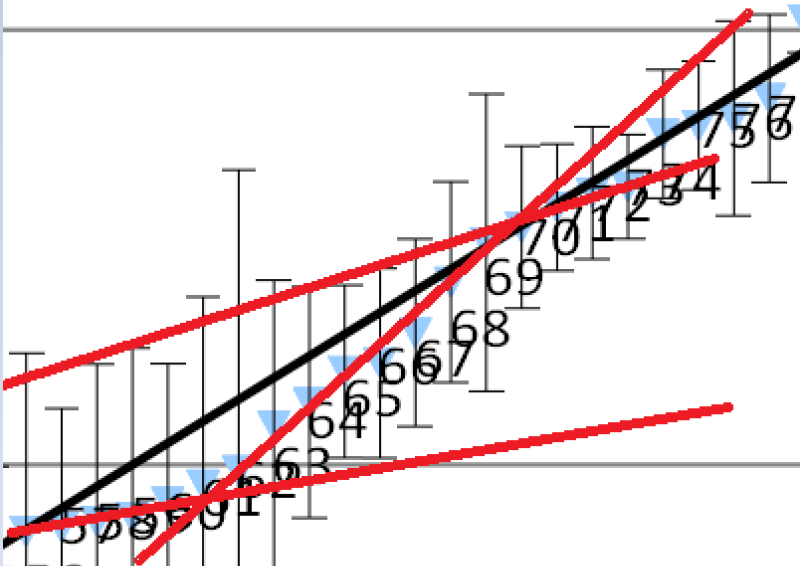
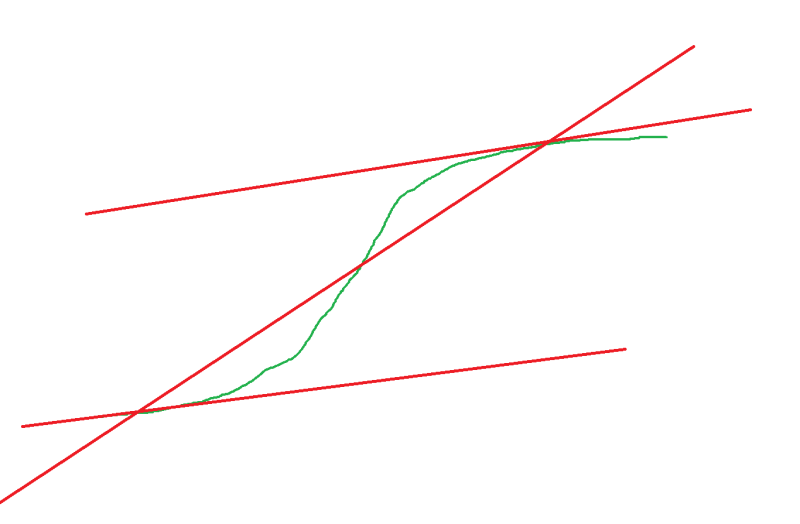
Here's another example from the ORAS OU VR 2019 in the diagram below. I have extracted the segment where mons 57-60 and 70-74 look pretty flat, but it's not so clear where the boundary is. I drew two lines that roughly fit the flat regions, and drew a diagonal cutting the points when they start to deviate (60 and 70). The diagonal appears to cause a separation at about 66/67. The diagram on the right shows a clearer schematic of what I mean.
Naming Tiers: Subdivisions
In the previous section, we explored some instances, especially in the ORAS OU VR 2019 and ADV OU VR 2020 where both distinguishability assumptions could not simultaneously hold. Here's a good example from the ADV OU VR 2020:
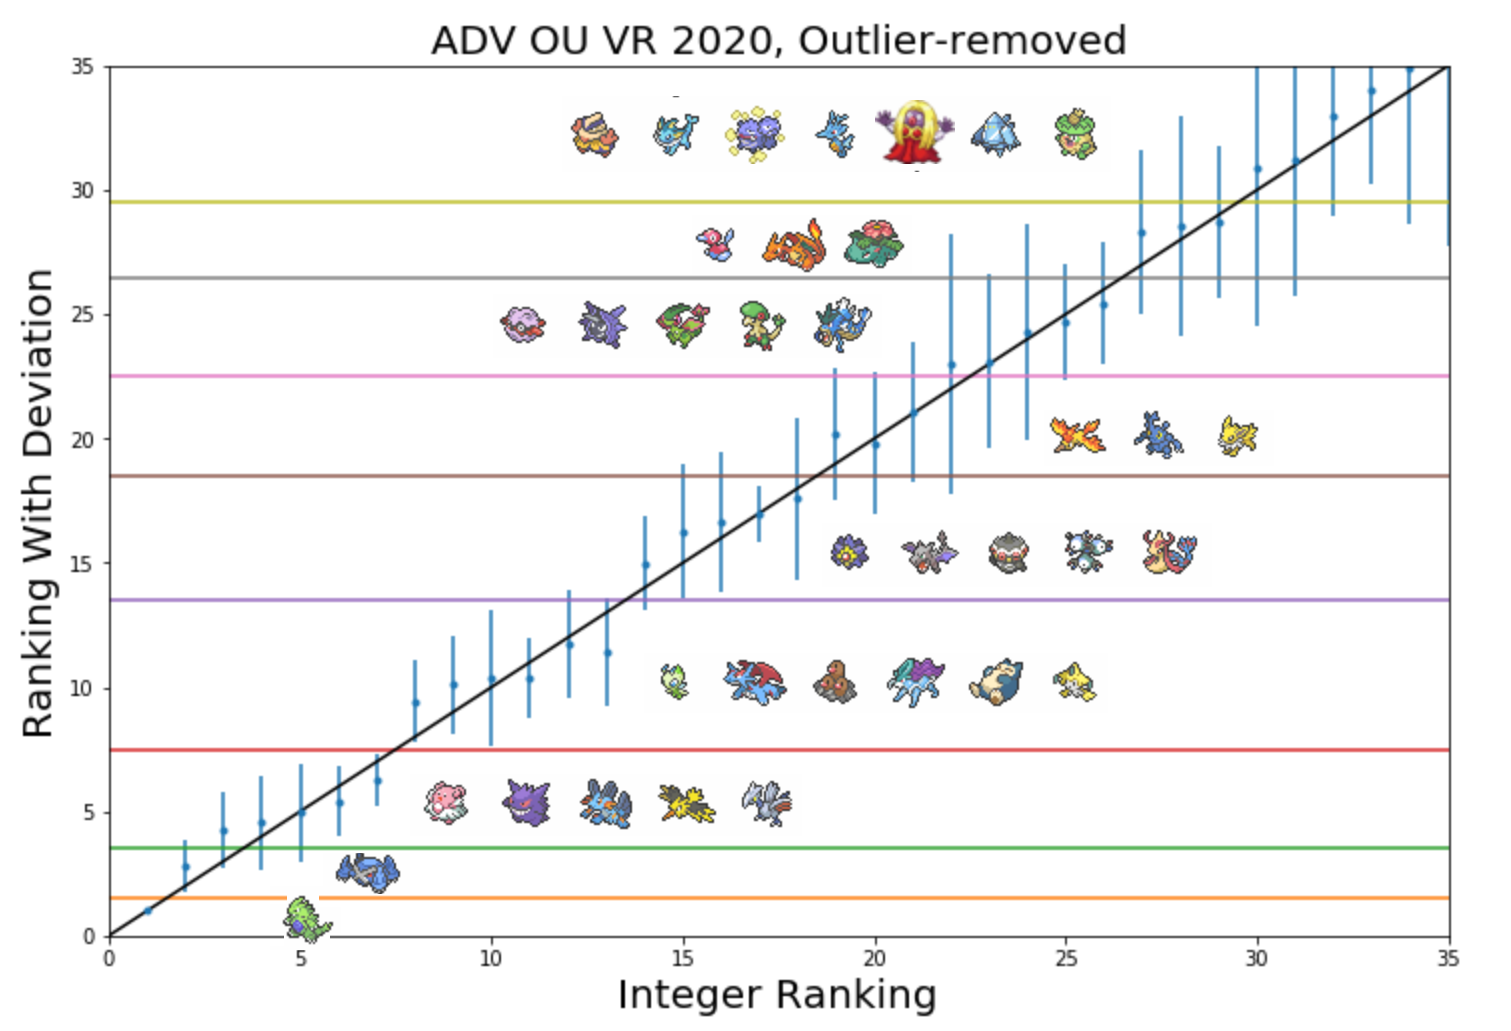
The tier that Celebi to Jirachi exists in is both distinct from other tiers, and indistinguishable within. However, the same cannot be said of the tier containing Moltres to Jolteon, because their deviations are so huge that they bleed into other tiers. In my opinion, this needs to be distinguished, because there is always someone among the data points who is going to look at the final tiering and say "but I think Forretress is better than Moltres, why is it in a higher tier? It should at least be in the same tier".
In such instances, traditional Smogon tiers using pluses and minuses like A+/A/A- cannot do these Pokemon justice because the tiering structure is going to be tripartite regardless of how people actually think of the relative closeness. A- is always going to sound closer to A than to B+. Thus, for this iteration of the ADV OU VR, I implemented numerical subranks in the following manner:
 to
to  - B tier
 to
to  - C tier
and I furthermore subdivided the C tier into
to  - C1
- C1
 to
to  - C2
- C2
 to - C3
so we can truly say that the boundary between B and C is definitely distinct, but there is some fuzziness between subdivisions C2 and C3.
This VR methodology could well work without inventing a new VR tier system, in the old +/- scheme, and admittedly the former might be easier for newcomers to understand, but that would not accurately capture the sentiments behind contributors to the VR.
Interpretation
The fact that this method yields much more than just some semblance of sanity is actually pretty amazing. If you think about it, McMeghan had not asked anyone for opinions on their tier limits. Only the rankings were obtained, yet the tiers naturally formed from player variations. This means,
1. It is a method of tiering that minimizes human bias.
2. It was surprisingly robust to the different metrics people used to evaluate mons, be it versatility vs efficacy, or at the level of operation (individual, core, archetype). A criticism of VRs are that mons fulfill niches on teams and are extremely subjective. These results tell us that we can measure subjectivity objectively, dividing the metagame into tiers of contained subjectivity, but with a common understanding of relative placements across tiers. Borrowing some ADV OU context, in more concrete terms, even though Zapdos and Snorlax do different things, there's a consensus that Zapdos is better at what it does/can do than Snorlax at what it does/can do. It should trigger some thought in people unfamiliar to the tier, or lead a semi-experienced player to think of fundamental flaws of Snorlax in its main role eg. a special wall that can't deal with WoW Gengar/Moltres, or gets overloaded by Sand, which is why spikeless offense tends to be electric weak etc.
Implementation (including Voter Selection)
Update Oct 1, 2019:
Since the advent of this VR methodology, we have learnt several practical lessons on implementing the VRs. Thanks to Altina and Earthworm's resourcefulness, we have learnt that the VR data can be easily collected via a ranked poll on a survey provider such as Surveymonkey. This data can then be processed in a spreadsheet that I have attached. Note that in implementing his poll,
Frequently, there are outliers in the data that should be removed so as to satisfy assumption B1 with normally distributed statistics. I recommend duplicating the "Raw" sheet, and removing outliers through whatever method one deems fit. The important point is not to let any user entry dominate the statistics. For example, in the GSC OU VR, one user with nonzero weight had really unorthodox rankings, so I removed outliers by taking away the highest and lowest ranking of each mon only if nobody else ranked gave that mon the same rank. A sample sheet, "Outlier_Removed", is provided. To get the final VR results, one can duplicate this sheet, sort by Weighted Average, and fill in the "Ranks" column
from 1,2,3... just as before. Again, a sample sheet, "Outlier_Removed_Sorted", is provided for reference and should be deleted in actual use.
Caveats
1. Tiering, especially tier shift, becomes more ambiguous as you get to the lower ranks, because of larger variance, and less reliable because some participants do not rank low tier mons. In the ADV OU tier, the techniques made sense till the black line (start of C rank), after which all points fell below the y=x line.
2. Cleaning your data and removing outliers may or may not be important. It didn't turn out to matter too much for ADV OU.
3. Enough contributors are needed to generate the required statistics. The ADV OU 2019 VR had 17.
4. Again, this has only been tested in the ADV OU 2019 VR. It would be far fetched to say it works for every tier, but I'm hoping it gets somewhere.
Add-on 4/30:
Speaking to tjdaas and Altina, some objections have been raised about the ability of using this
O1. In tiers that are too centralized
O2. In tiers are in flux
O3. For lower ranks.
Addressing O1:
Tjdaas informed me that most RBY players would provide a ranking like
1. Tauros
2. Chansey/Snorlax
3. Chansey/Snorlax
4. Exeggutor, sometimes Starmie
5. Starmie
6. Alakazam
In this case, the method would create tiers something like
Tier 1: Tauros
Tier 2: Chansey, Snorlax
Tier 3: Exeggutor
Tier 4: Starmie
Tier 5: Alakazam
As mentioned earlier, tiers form from player variations, so when there are no variations, a single mon occupies a tier, indicating that this mon is in a different league from the ones above it and yet also below it. This accurately captures the essence of the two key distinguishability assumptions, albeit forming tiers with a small number of mons. Remember that a corollary of our assumptions is that if everyone ranked a list the same way, there is no need for tiers. A tier is useful only because it says something like Articuno = Zapdos = Moltres > Vaporeon = Jolteon = Flareon. Without approximate equalities defining tiers, it doesn't make sense in this article's definition of a tier to say Tauros is in the same tier as Snorlax, but I'd rather always keep my Tauros alive in an RBY game rather than my Snorlax (just a guess, I'm not a RBY player).
Addressing O2:
Tiers in flux will be likely be subject to a high standard deviation, especially if the contributors are not up-to-date. Part of this is a data selection issue -- deciding who is a relevant contributor and who isn't. If that is accounted for though, then any remaining ambiguous tiers that don't satisfy both distinguishability criterion (such as the B or C tier in ADV OU) is an indication that sub-tiering to that level may not be useful. This to me is not a flaw of the methodology, but a result indicating no matter how one tries to divide the tier, there are a significant number of contributors that will disagree (the same people who cause the error bars to bleed from one tier to the other). It's not possible to make everyone happy in such a tier, even if any other tiering method was used.
Addressing O3:
Lower ranks suffer from two problems. First, as mentioned in O2 and from our experience in ADV OU, at least one of the distinguishability criterion is likely not satisfied, so refer to O2 for this response. Second, contributors just don't rank some mons in lower tiers because they're just not important to them. A practical but contentious way of resolving the latter includes requiring contributors to rank from a prescribed list. An impractical but less contentious way requires contributors to rank at least X number of mons with the intention to cut down a percentage of them down to a common list. A biased but practical and non-contentious way would be to just give every unranked mon a fake low rank ceiling in place -- but then there isn't really a point of separating the low tiers because they are so heavily biased by responses.
In all, to me, the most significant impediment is the selection of contributors. Contributors have to be competent and up-to-date with the tier, and there must be a sufficient number of them for the data to look clean. Perhaps that is where the greatest subjectivity lies.
History
The chronology, as well as interesting features and results of this VR methodology as compared to previous methods are captured here.
Closing Remarks
I feel that this has some potential, and really hope I can reach out to the other tiers doing Viability Rankings through this post, without having to double post across forums. Finally, this is an analysis that can be easily implemented in Excel (see attached .zip file), and I'd be happy to help with any questions about doing this analysis. I'm a physicist by training, not a statistician, so I might have made some mistakes. Please feel free to point out improvements or just plain wrong things I said, as well as your opinion on such an endeavor, useful considerations going forward, perhaps even pointing the right people to this post if you think it's useful. Thanks!
Q: This is a pain. Do I really need to rank every Pokemon precisely?
A: No, the beauty of the method is that you don't need to precisely rank things you don't know! Just rank approximately. If you can't properly rank C-tier mons, but know where the cutoff is from D-tier mons, and everyone else kind of agrees with you where the cutoff is, the tiers will be formed correctly regardless of how you ranked it.
Q: The tiers formed by this method don't make any sense! How do we relate it to S/A+/A/A-?
A: Strictly speaking, the methodology may create letter-labeled tiers that don't correspond to conventional notions, as the labels are determined by relative separations between ranking clusters. However, in practice, we come to some compromise with the VR coordinators and alter the labels to fit what people are used to.
Q: Do the final ranks actually matter?
A: The methodology spits out a ranked order of tiers, within which the mons' ranks are unimportant (see first question). However, since so much information can be obtained, the ranks are used to calculate the improvements and drops from previous VRs as well.
(do not read with Smogon Dark theme; you won't be able to see the graphs; click here to change your theme)
Check the 2nd post for major updates!
Hello everyone,
I'm here to share a mathematical-visual tool to the wider community for evaluating Viability Ranking (VR) tiers, especially contributors who do VR outside my main gen. I believe that an objective method founded in mathematics but visually convincing to a lay audience should appeal to a wide spectrum of people.
Recently, there has been some discussion on how to separate the ADV OU (my main) VR tiers. Questions such as "Should Zapdos belong in A+ or A", or "Is it even meaningful to separate the B tier into B-/B/B+?" were asked, and I believe I have come up with a tool helpful for answering these questions. I also hope that this post can elucidate the process to those who participated on that thread.
Key Assumptions
This methodology is premised on two key assumptions:
A1. Every mon in a tier should be mostly indistinguishable from any other in the same tier.
A2. Every mon in a tier should be convincingly distinguishable from every mon in another tier.
And mathematically, for reliability we require that
B1. Enough players contribute their VR, or outliers removed, so that the central limit theorem holds and ranking statistics can be treated as normal distributions. The standard deviation can thus be meaningful statistic.
Together, these premises require that
1. Within a tier, each mon has a ranking with standard deviation that stays within the mean (average) ranking,
2. At the transition from a higher to lower tier, the mean rankings will go from a overestimate to underestimate.
Methodology through an Example
Let's take a look at an instructive example. Imagine a world of eight pokemons where are there two tiers: the legendary trio and eeveelutions. Contributors to the VR gave the following ranking statistics (final integer rank, mean +/- deviation).
1, 1.9 +/- 1.0 Articuno
2, 2.0 +/- 1.0 Zapdos
3, 2.1 +/- 1.0 Moltres
4, 5.8 +/- 2.0 Vaporeon
5, 5.9 +/- 2.0 Flareon
6, 6.0 +/- 2.0 Jolteon
7, 6.1 +/- 2.0 Umbreon
8, 6.2 +/- 2.0 Espeon
We can do a scatter plot of these results.
In this figure, I have plotted on the y axis the mean ranking +/- a standard deviation as error bars. On the x axis, I have plotted the final integer ranking decided by the mean rank. Notice that the legendary trio and the eeveelutions, which are the tiers, essentially form a flat line, and the deviations of each mon overlap the others mean rankings in the same group (satisfying A1), but do not overlap with those in the other group (satisfying A2). In my imaginary sample, contributors thought the legendary trio members were on the whole better than the eeveelutions, but could not decide convincingly among either group who came ahead. It is only by a small margin that Articuno and Vaporeon came ahead. This is exactly the definition of a tier at the start of the article, and tier boundaries can be defined this way.
How else could we have noticed this? On the same plot, I have drawn the diagonal line y=x, representing where points would lie if everyone posted the same VR. Ironically, this is a boring world where there are no tiers. A way to understand this is that tiers are born out of players' natural disagreements in rankings. The substitution of mons by different people in the same ranking position is what generates the idea that two mons are roughly the same quality. We can exploit this to define a tier too.
Points that lie below the y=x line are ranking overestimates: i.e. people clearly think of Moltres as in the same league as Articuno, but it is through the vagaries of a slight 0.2 disadvantage that it was relegated from roughly #2 on average to #3. It's like losing a really close semifinals with the champ and getting bronzes (sorry Hclat ). Similarly, points that lie above are underestimates. Vaporeon isn't Moltres standard by a longshot, but enjoys the luxury of being #4 instead of roughly #6 on average because someone needs to get the consolation prize anyway. Thus, the bottom of a tier will have its rank overestimated/underrated, and the top of a tier will be rank-underestimated/overrated (sorry this is a bit confusing, a rank overestimate is a numerically higher rank, which is a worse rank). A tier shift can be seen a jump from below to above the y=x line. This method is good for one's understanding but is less reliable than just looking at the means and deviations, because outliers can severely skew the points away from the diagonal line, causing all the points to be on one side like those of rank >30 in the ADV OU VR below.
The method of determining tiers now is simple:
Step 1. Plot the graph
Step 2. Find flat portions (I'll call this a tier-line) within the standard deviations of the mons that also exclude other mons. This defines a tier. To find the boundaries especially in more ambiguous cases, identify two consecutive flat-ish portions, and try to find the midpoint.
Step 3. This is not necessary but think of it as a real smoking gun: Find positions where there is a transition from below to above the diagonal line. This would define a tier shift when there are no outliers. (2) and (3) should almost coincide, and should exactly coincide if all contributors' votes did not spill to other tiers.
Real Data and Dealing with Ambiguity: ADV OU Viability Ranking 2019
Finally, let's take a look at some real data. This is the same plot generated from outlier-removed data provided by McMeghan of the ADV OU VR in https://www.smogon.com/forums/threads/adv-viability-ranking-ou.3503019/post-8115920
To quote verbatim from my post over there,
The first four tiers, which I will conventionally call S/A+/A/A-, have rather distinct flat tier-lines and boundaries demarcated by the green/red/blue/magenta lines. Now things get tricky. At that point, the B tier-line from magenta to black become less flat and the distinguishability assumptions A1 and A2 cannot both hold true. We have now come to the question of how one should subdivide lower tiers, where the tier distinguishability assumptions cannot simultaneously hold. In this scenario, there is no way to please everyone. On the one hand, sticking with a single tier will not satisfy those who believe that the start of the tier is clearly better than those at the end. On the other hand, subdividing would not satisfy those who believe that there isn't a distinct difference especially between mons sandwiched between the two tiers. I have to make a compromise and relax an assumption.At the bottom left corner is Tyranitar, which everyone agrees is #1 and has zero standard deviation, clearly belongs in the S tier.
The next three mons #2-4 are Gengar, Metagross and Swampert, which are really close up to error bars. Zapdos, at #5, is clearly behind #2-4, and is in roughly the same league as Skarmory and Blissey (#6-7). From #8-13, Celebi, Suicune, Jirachi, Snorlax, Salamence, Dugtrio clearly form a tier of their own. This concludes what many of us might be inclined to call the A tier.
#14 Starmie, on the border of the magenta line, is in a strange league of its own, not up to the standards of Salamence/Dugtrio, but clearly more preferred than Magneton. It may be considered B+. Here, the standard deviations start not to cover entire tiers, and the spread is more uniform. From #15-20, you have Magneton, Claydol, Aerodactyl, Jolteon, Heracross, Moltres, which are slightly distinguished from #21-26, Milotic, Flygon, Cloyster, Forretress, Porygon2, Gyarados. #27 is Venusaur, which sits on the border of the black line separating what you may like to call the B and C tier (Hariyama onwards).
Rewritten for simplicity: The VR tiers from this nominally stands at
S: Tyranitar
A+: Gengar, Metagross, Swampert
A: Zapdos, Skarmory, Blissey
A-: Celebi, Suicune, Jirachi, Snorlax, Salamence, Dugtrio
Borderline A/B: Starmie
B1: Magneton, Claydol, Aerodactyl, Jolteon, Heracross, Moltres
B2: Milotic, Flygon, Cloyster, Forretress, Porygon2, Gyarados
To me, these results appear reasonable. For example, Metagross and Swampert are imo up a notch in versatility compared to Zapdos. Skarmory and Blissey come together. The "B" mons Magneton-Moltres all occupy positions on some notable archetypes (Magdol, Aero spikes, Jolt spikes, Heracross phys spam, Molt TSS that can either come with Flygon or Forre), while Milotic to Gyarados have less of a clear presence on teams, with the exception of Porygon2 archetypes (CMspam) that appear to be becoming less relevant imo.
1. Relax A1: Do not divide the tier into subtiers. Acknowledge that there will be variation within the tier.
2. Relax A2: Divide the tier into sections of the size of the error bars. Within each subtier the mons are now more equal, but it's not so easy to see the differences across subtiers. In my original post, I just subdivided the tier anyway with the yellow line, because the error bars were roughly half the size of the tier. This ended up making reasonable sense, and would eventually lead to the idea of subdivisions (next section).
The tiers eventually looked reasonable, and there are some surprises, such as the controversial Starmie not belonging in any tier.
Here's another example from the ORAS OU VR 2019 in the diagram below. I have extracted the segment where mons 57-60 and 70-74 look pretty flat, but it's not so clear where the boundary is. I drew two lines that roughly fit the flat regions, and drew a diagonal cutting the points when they start to deviate (60 and 70). The diagonal appears to cause a separation at about 66/67. The diagram on the right shows a clearer schematic of what I mean.
Naming Tiers: Subdivisions
In the previous section, we explored some instances, especially in the ORAS OU VR 2019 and ADV OU VR 2020 where both distinguishability assumptions could not simultaneously hold. Here's a good example from the ADV OU VR 2020:
The tier that Celebi to Jirachi exists in is both distinct from other tiers, and indistinguishable within. However, the same cannot be said of the tier containing Moltres to Jolteon, because their deviations are so huge that they bleed into other tiers. In my opinion, this needs to be distinguished, because there is always someone among the data points who is going to look at the final tiering and say "but I think Forretress is better than Moltres, why is it in a higher tier? It should at least be in the same tier".
In such instances, traditional Smogon tiers using pluses and minuses like A+/A/A- cannot do these Pokemon justice because the tiering structure is going to be tripartite regardless of how people actually think of the relative closeness. A- is always going to sound closer to A than to B+. Thus, for this iteration of the ADV OU VR, I implemented numerical subranks in the following manner:
to - B tier to - C tierand I furthermore subdivided the C tier into
to - C1 to - C2 to - C3so we can truly say that the boundary between B and C is definitely distinct, but there is some fuzziness between subdivisions C2 and C3.
This VR methodology could well work without inventing a new VR tier system, in the old +/- scheme, and admittedly the former might be easier for newcomers to understand, but that would not accurately capture the sentiments behind contributors to the VR.
Interpretation
The fact that this method yields much more than just some semblance of sanity is actually pretty amazing. If you think about it, McMeghan had not asked anyone for opinions on their tier limits. Only the rankings were obtained, yet the tiers naturally formed from player variations. This means,
1. It is a method of tiering that minimizes human bias.
2. It was surprisingly robust to the different metrics people used to evaluate mons, be it versatility vs efficacy, or at the level of operation (individual, core, archetype). A criticism of VRs are that mons fulfill niches on teams and are extremely subjective. These results tell us that we can measure subjectivity objectively, dividing the metagame into tiers of contained subjectivity, but with a common understanding of relative placements across tiers. Borrowing some ADV OU context, in more concrete terms, even though Zapdos and Snorlax do different things, there's a consensus that Zapdos is better at what it does/can do than Snorlax at what it does/can do. It should trigger some thought in people unfamiliar to the tier, or lead a semi-experienced player to think of fundamental flaws of Snorlax in its main role eg. a special wall that can't deal with WoW Gengar/Moltres, or gets overloaded by Sand, which is why spikeless offense tends to be electric weak etc.
Implementation (including Voter Selection)
Update Oct 1, 2019:
Since the advent of this VR methodology, we have learnt several practical lessons on implementing the VRs. Thanks to Altina and Earthworm's resourcefulness, we have learnt that the VR data can be easily collected via a ranked poll on a survey provider such as Surveymonkey. This data can then be processed in a spreadsheet that I have attached. Note that in implementing his poll,
The order of mons should be randomized or placed in alphabetical order to prevent bias from the last VR. Although I had suggested the above, I now think that using the previous VR as a standard allows people to think in terms of changes to the metagame more concretely and is more convenient, and I do not oppose doing so.- For tiers with large lists of mons, if contributors find it too difficult to rank everything, it should be communicated to them that it is only necessary to rank to the precision of their level of confidence. For example, it does not matter too much if a contributor cannot decide if #80 > #81 and swaps their places because it is within the standard deviation anyway. However, if a voter is very sure that #1 is better than #2, they must be precisely ranked. Similarly if for whatever reason the voter thinks #81 is definitely better than #82, that must be captured. Importantly, for regions of low confidence, although mons close by may not need to be precisely ranked, the voter should have higher certainty in ranking groups of them. In other words, although #80 and #81 may be hard to distinguish, the voter should make sure that #60-#70 should be on average better than #71-80. Following these guidelines should ensure that voters minimize their effort on ranking 100 mons but still capture the essence of what they feel are tiers.
- A question on additions and removals can be posted, but I think these modifications should be made by the VR coordinator after the quantiative analysis has been performed.
Frequently, there are outliers in the data that should be removed so as to satisfy assumption B1 with normally distributed statistics. I recommend duplicating the "Raw" sheet, and removing outliers through whatever method one deems fit. The important point is not to let any user entry dominate the statistics. For example, in the GSC OU VR, one user with nonzero weight had really unorthodox rankings, so I removed outliers by taking away the highest and lowest ranking of each mon only if nobody else ranked gave that mon the same rank. A sample sheet, "Outlier_Removed", is provided. To get the final VR results, one can duplicate this sheet, sort by Weighted Average, and fill in the "Ranks" column
from 1,2,3... just as before. Again, a sample sheet, "Outlier_Removed_Sorted", is provided for reference and should be deleted in actual use.
Caveats
1. Tiering, especially tier shift, becomes more ambiguous as you get to the lower ranks, because of larger variance, and less reliable because some participants do not rank low tier mons. In the ADV OU tier, the techniques made sense till the black line (start of C rank), after which all points fell below the y=x line.
2. Cleaning your data and removing outliers may or may not be important. It didn't turn out to matter too much for ADV OU.
the use of the central limit theorem in B1 requires that these outliers not skew the normal distribution. Outlier removal could be something like remove all points some fraction of the median away from the median. The quality of data can be checked by bootstrapping (forming a distribution of the averaged ranking of a particular mon by sampling with replacement).
4. Again, this has only been tested in the ADV OU 2019 VR. It would be far fetched to say it works for every tier, but I'm hoping it gets somewhere.
Add-on 4/30:
Speaking to tjdaas and Altina, some objections have been raised about the ability of using this
O1. In tiers that are too centralized
O2. In tiers are in flux
O3. For lower ranks.
Addressing O1:
Tjdaas informed me that most RBY players would provide a ranking like
1. Tauros
2. Chansey/Snorlax
3. Chansey/Snorlax
4. Exeggutor, sometimes Starmie
5. Starmie
6. Alakazam
In this case, the method would create tiers something like
Tier 1: Tauros
Tier 2: Chansey, Snorlax
Tier 3: Exeggutor
Tier 4: Starmie
Tier 5: Alakazam
As mentioned earlier, tiers form from player variations, so when there are no variations, a single mon occupies a tier, indicating that this mon is in a different league from the ones above it and yet also below it. This accurately captures the essence of the two key distinguishability assumptions, albeit forming tiers with a small number of mons. Remember that a corollary of our assumptions is that if everyone ranked a list the same way, there is no need for tiers. A tier is useful only because it says something like Articuno = Zapdos = Moltres > Vaporeon = Jolteon = Flareon. Without approximate equalities defining tiers, it doesn't make sense in this article's definition of a tier to say Tauros is in the same tier as Snorlax, but I'd rather always keep my Tauros alive in an RBY game rather than my Snorlax (just a guess, I'm not a RBY player).
Addressing O2:
Tiers in flux will be likely be subject to a high standard deviation, especially if the contributors are not up-to-date. Part of this is a data selection issue -- deciding who is a relevant contributor and who isn't. If that is accounted for though, then any remaining ambiguous tiers that don't satisfy both distinguishability criterion (such as the B or C tier in ADV OU) is an indication that sub-tiering to that level may not be useful. This to me is not a flaw of the methodology, but a result indicating no matter how one tries to divide the tier, there are a significant number of contributors that will disagree (the same people who cause the error bars to bleed from one tier to the other). It's not possible to make everyone happy in such a tier, even if any other tiering method was used.
Addressing O3:
Lower ranks suffer from two problems. First, as mentioned in O2 and from our experience in ADV OU, at least one of the distinguishability criterion is likely not satisfied, so refer to O2 for this response. Second, contributors just don't rank some mons in lower tiers because they're just not important to them. A practical but contentious way of resolving the latter includes requiring contributors to rank from a prescribed list. An impractical but less contentious way requires contributors to rank at least X number of mons with the intention to cut down a percentage of them down to a common list. A biased but practical and non-contentious way would be to just give every unranked mon a fake low rank ceiling in place -- but then there isn't really a point of separating the low tiers because they are so heavily biased by responses.
In all, to me, the most significant impediment is the selection of contributors. Contributors have to be competent and up-to-date with the tier, and there must be a sufficient number of them for the data to look clean. Perhaps that is where the greatest subjectivity lies.
History
The chronology, as well as interesting features and results of this VR methodology as compared to previous methods are captured here.
- ADV OU (April 2019): 16 voters, ~50 mons. Original Post. The tiers obtained were rather intuitive -- S: the centralizing mon, A+: Premier Spinblocker+Glues, A: Premier Offensive Utility + Defensive Core, A-: Mons used for matchup advantage, B+: Starmie, B: Mons used in specific archetypes. Notably, the single-mon tier of Starmie was formed, presumably emphasizing Starmie's highly matchup-dependent nature.
- RBY OU (May 2019): 15 voters, ~50 mons. Features three single-mon tiers at the top, emphasizing the hierarchical nature of RBY OU.
- GSC OU (July 2019): 28 voters, ~50 mons. Again we see two single-mon tiers at the top, and a single-mon Tentacruel tier at #24. Compared to the previous GSC OU VR, this update yielded more, smaller tiers (7 vs 5 tiers) up till #19. It also features a weak but distinct cutoff from C to C-, which demonstrates the possibility of tiering even lower tiers.
- ORAS OU (Sep 2019): 17 voters, ~100 mons. The first time the method has been used in a tier with up to 100 active mons. There were initial concerns about the labor going into performing the rankings, but to the point of ranking only to the degree of uncertainty was communicated to voters to ease their job. On a separate point, this VR deviates from the conventional tripartite +/- scheme of tier subdivisions, Instead, the B tier was found to be subdivided into 4 segments, for example. This is because the distinctiveness of a tier boundary determines if said tier is a subtier or full tier. Altina confirmed as an ORAS player that if +/- divisions were made instead, some subtiers would awkwardly not fit in, as they were closer in viability to the adjacent main tier. Numeric subranks of this method help to differentiate the larger and smaller gaps between mons.
- GSC Ubers (Sep 2019): 14 voters, ~30 mons. The first time weights were tagged to voters to determine their influence in the rankings. This takes into account different levels of experience in a small population playing a niche tier.
- ADV OU (April 2020): 22 voters, ~50 mons. This VR, like ORAS OU, deviates from the tripartite +/- scheme of tier subdivisions in favor of numerical ranks.
- RBY OU (April 2020): 24 voters, ~ 50 mons. Hierarchical clustering on each tier was used to determine the presence of camps of players within RBY OU, and some trends observed can be explained by someone with metagame knowledge.
Closing Remarks
I feel that this has some potential, and really hope I can reach out to the other tiers doing Viability Rankings through this post, without having to double post across forums. Finally, this is an analysis that can be easily implemented in Excel (see attached .zip file), and I'd be happy to help with any questions about doing this analysis. I'm a physicist by training, not a statistician, so I might have made some mistakes. Please feel free to point out improvements or just plain wrong things I said, as well as your opinion on such an endeavor, useful considerations going forward, perhaps even pointing the right people to this post if you think it's useful. Thanks!
Attachments
-
75.3 KB Views: 724
Last edited:
